In 2026, if your dashboard still looks the way it did five years ago, you’re not measuring the customer support KPIs that matter. With the widespread adoption of AI and automation, customer support has shifted, and traditional KPIs no longer reflect modern support environments. For an updated KPI dashboard, organizations need a clear framework for what actually matters and track contemporary metrics in this new environment.
TL;DR for Customer Support KPIs in 2026
- Customer support KPIs that worked five years ago could be working against you today.
- Measuring support through a four-pillar framework of speed, quality, cost, and loyalty offers a clearer picture.
- Upgrade your dashboard: Resolution time, automation rate, and retention impact are some KPIs to track in 2026.
- Tracking AHT, ticket volume, and closed ticket rates without context, is not enough
- Upgrade your dashboard, isolated metrics without context quietly cost you customers through churn.
Why Customer Support KPIs Are Changing in 2026?
With AI handling what human agents used to handle, old benchmarks like average handle time (AHT) and ticket volume don’t apply the same way they used to. Workflows have changed with automation, routing, and self-service options, making the customer support journey look very different today.
Support is moving from reactive to proactive, from fixing problems to preventing them. At the same time, leaders used to measure support purely as a cost of control, and now they want to prove that it contributes to customer retention and revenue growth.
Customer Support Metrics Framework: Speed, Quality, Cost, and Loyalty
A framework for customer support needs to look at the full picture. While the old way of measuring was one-dimensional, a modern KPI lens considers four pillars: speed, quality, cost, and loyalty.
- Speed: how fast you respond and resolve, but with context
- Quality: how the customer actually felt about the interaction (CSAT and CES)
- Cost: not just cheap, but efficient and effective; and what automation contributes to that
- Loyalty: the long game, retention, and lifetime value, with support as a revenue driver, not just a cost center
These four pillars work together, and optimizing one at the expense of another is where dashboards go wrong.
8 Customer Support KPIs That Actually Matter in 2026
When it comes to using a modern KPI framework built on the four pillars of speed, quality, cost, and loyalty, clarity is more important than tracking everything. With fewer customer service metrics tied directly to this framework, every metric on your dashboard has a clear purpose. Together, they tell a more complete story.
1. First Response Time
Since slow first response time correlates directly with customer frustration and churn risk, measuring how quickly a support agent sends the first reply after a ticket is opened is a useful baseline. However, first response time benchmarks can be misleading if they measure automated acknowledgments rather than meaningful human responses. In other words, a quick “we got your ticket” isn’t the same as a fast answer.
2. Resolution Time
Resolution times measure how long it takes to fully resolve a customer issue from open to close. This is a more meaningful KPI than AHT because it measures the outcome rather than the activity. Faster resolution times drive satisfaction and reduce the costs of repeat contacts, though the metric can be misleading if tickets are closed prematurely to meet targets.
3. Customer Satisfaction + Effort (CSAT vs NPS vs CES)
There are three distinct metrics used to measure customer satisfaction. Together, they connect support quality directly to loyalty and retention.
- CSAT: Customer satisfaction with an interaction
- NPS: Net promoter score, or likelihood to recommend your brand
- CES: Customer effort score, or how much effort it took to get help
Understanding how CSAT vs NPS vs CES metrics work together is what makes them useful. Since each captures a different dimension of CX, looking at these together rather than in isolation gives you a fuller picture of where your support experience is winning and where it’s falling short.
4. Cost Per Resolution (Not Just Cost Per Ticket)
The total cost per resolution, which includes agent time, tools, and overhead, is a more meaningful customer support performance metric than the cost per ticket because it accounts for resolution complexity and repeat contacts. Because a cheap ticket that doesn’t solve the problem isn’t actually cheap, this KPI drives smarter investment decisions around staffing, automation, and self-service rather than raw cost-cutting.
5. Automation Resolution Rate
Automation resolution rate is a relatively new customer support KPI that’s not on many dashboards. It is useful as an efficiency measure for AI in customer support, but it’s misleading if it counts deflections rather than true resolutions. This distinction matters because a customer who gave up isn’t the same as a customer whose problem was solved. A high automation rate, done right, reduces costs while maintaining customer satisfaction, which is the real measure of whether your automation is actually working.
6. Escalation Rate
The percentage of tickets escalated from frontline support to a higher tier is a useful customer support KPI because it signals a broken workflow or a knowledge gap. High escalation rates are usually attributable to agents lacking the tools, training, or authority to resolve issues at first contact. Reducing escalation connects directly to the pillars of cost and loyalty by improving both efficiency and customer experience.
7. Customer Retention Impact from Support
Support interactions affect whether customers remain loyal, but most organizations haven’t connected the data sets that tie support to retention. To do this, you need to track the impact of support on customer retention, a KPI that measures how support interactions directly influence whether customers stay or leave. When support is tied to customer retention metrics, it stops being a cost center and becomes a revenue driver.
8. Proactive Support Success Rate
The proactive support success rate is a forward-looking KPI that connects predictive and AI-driven support. It’s a measurement of how your team identifies and resolves potential issues before the customer reaches out. Since it’s predictive, it’s harder to measure than reactive KPIs, but it’s more valuable because it reduces inbound volume, improves CX, and signals a mature AI-enabled support operation.

5 Customer Support KPIs That Can Mask Real Problems – If Out Of Context
Some customer support performance metrics make sense on your dashboard, but because they measure activity instead of outcomes, they can mask real problems and hurt performance if taking out of context. The following metrics were built for a different era, since CX is evolving, keeping them in isolation could be costing you more than you think. So, let’s explore how to take advantage of both traditional and emerging KPIs to strengthen your decision making skills.
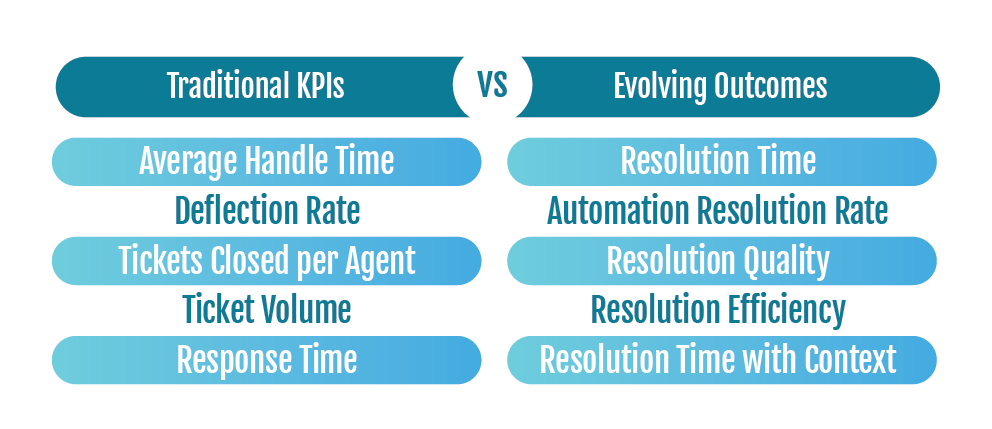
1. Average Handle Time
The average time an agent spends on a customer interaction from start to finish is a metric that could undermine quality and loyalty by prioritizing speed over resolution. Because it incentivizes agents to rush through interactions rather than actually solve the problem, it costs you customer satisfaction and first-contact resolution. Contrasting AHT with resolution time brings the customer experience back into focus.
2. Ticket Deflection Rate
The ticket deflection rate is the percentage of customers who don’t submit a ticket after being offered self-service options. Counting a deflection the same as a resolution is misleading because it treats customers who gave up as a win. This undermines quality and makes it harder to see what’s causing unresolved issues. Instead, replacing this metric with automation resolution rate gives you a clearer picture of what automation is actually resolving.
3. Tickets Closed Per Agent
The number of tickets closed per agent is another traditional KPI that rewards volume over effectiveness, undermining quality and incentivizing cherry-picking easy tickets. Under the old metric, an agent that’s actually solving complex problems looks worse than one closing a high volume of simple tickets, but is actually more valuable. A more effective approach is to use resolution-quality metrics that measure resolution quality and complexity, not just the count.
4. Raw Ticket Volume
The raw ticket volume, or total number of support tickets received in a given period, is misleading because it doesn’t reflect complexity or outcomes. With no meaningful signal across speed, quality, cost, and loyalty, it undermines all four pillars. High volume could indicate a product problem, a knowledge gap, or an unaddressed training issue, but with this outdated KPI, you have no real context. Adding resolution efficiency to your customer support KPIs is a better alternative that tells you what the volume means.
5. Response Time Without Resolution Context
When the speed at which an agent responds to a ticket is measured in isolation, you lose the full picture. Speed alone is misleading because it tells you nothing about whether the customer’s problem was solved. A fast response that doesn’t resolve issues undermines quality and loyalty by treating speed as the only measure of success. Ticket resolution time, paired with response time, tells you what actually matters: whether the issue was actually solved, not just answered.
How to Improve Customer Support KPIs in 2026
Improving your customer support metrics starts with knowing what you’re working with, fixing what’s broken, and optimizing for better outcomes. While leadership sees green and everything looks good on paper, outdated customer support KPIs can create dangerous blind spots as customers quietly churn. By disconnecting the dashboard from key customer outcomes, insights can be undermined. Instead, audit your dashboard and determine whether each metric connects to what the customer actually experienced.
Audit: Review your current customer service metrics against the four pillars – speed, quality, cost, and loyalty – and identify what’s measuring activity rather than outcomes.
- Flag metrics that incentivize wrong behavior
- Identify knowledge base gaps driving escalation
- Connect support data to churn and retention data
Fix: Rebuild your KPIs around resolution rather than speed.
- Redesign workflows for first contact resolution
- Fill knowledge base gaps
- Replace vanity metrics with KPIs that matter
Optimize: Scale what works.
- Integrate AI and automation for resolution, not deflection
- Build staffing models around complexity instead of volume
- Connect support outcomes to revenue
For scalable, global support operations, standardizing around the four pillars ensures consistency no matter how your team grows.
Final Thoughts: Your KPI Dashboard Needs an Upgrade
When you view your customer support KPIs through a modern lens and stack them up against the four pillars of speed, quality, cost, and loyalty, it’s easy to see that the way support gets measured has to catch up with the way it gets delivered. Legacy metrics built for a different era may be holding your teams back; replacing them on your dashboard with outcome-based metrics will give you a truer picture of performance.
The best support organizations in 2026 are those that have combined efficiency and experience, rather than trading one for the other. With this framework, AI-enabled operations aren’t just about efficiency; they’re also about delivering better experiences. For support operations that need to scale, the right customer support metrics make that possible.

About Zahoree Support
Customers want to purchase from businesses that offer personalized, but well integrated solutions, resolve their issues quickly, and maintain consistent service across all channels. Meeting these expectations can be difficult, especially if you have limited resources. But it doesn’t have to be. Zahoree’s expertise and proven quality is unique in the market. Zahoree’s Platform and AI ZWingman™ will deliver the analytics your are looking for.
Zahoree’s technologies can automate advanced CX insights about your support team’s performance and CX quality. Zahoree will give you the visibility you need to identify where the gaps are in productivity and CX delivery all the way from support to your customer’s journey. Contact us and discover how our hybrid toolbox – Human + AI – will help you strengthen your CX challenges.
Take the first step by contacting Zahoree today!